Introducing URL Inspector: A High-Performance Desktop Suite for Real-Time Web Diagnostics, Core Web Vitals & Traffic Shaping
By André Jaccon — Software Architect & Performance Engineer
Repository: https://github.com/jaccon/url-inspector
Every frontend engineer, Site Reliability Engineer (SRE), and web architect knows the drill: a user complains about slow page loads, and you immediately open Chrome DevTools. You run a Lighthouse audit, inspect the Network tab, squint at waterfall bars, and wonder why the synthetic score from a cloud-hosted test doesn't match the reality of real users on volatile connections.
Traditional browser DevTools are indispensable, but they weren't designed to be dedicated diagnostic workstations. They don't automatically test your own client bandwidth before auditing. They don't maintain a queryable local database of your historical test runs. And when modern single-page applications defer script loading or stream data through third-party microservices, standard tools often cut off telemetry prematurely.
To solve this, I built URL Inspector — an open-source, desktop performance engineering environment designed from the ground up for deep network observability, deterministic traffic shaping, and Core Web Vitals diagnostics.
Here is why I created it, how it works under the hood, and how it can supercharge your performance workflows.
Before installation execute:
sudo xattr -d com.apple.quarantine "/Applications/URL Inspector.app/"
The Problem: Blind Spots in Modern Web Auditing
When troubleshooting real-world web performance, engineering teams routinely hit three major roadblocks:
- Synthetic Cloud Audits Lack Client Context: Online audit services run on high-bandwidth datacenter virtual machines. They can't tell you how your web application behaves under genuine last-mile constraints or whether your own testing connection is bottlenecking the results.
- Ephemerality of DevTools Data: Once you close a DevTools tab, your request logs, waterfall timelines, and vitals are gone unless you manually export and archive bulky HAR files.
- Third-Party API & Lazy-Load Noise: Modern web applications load dozens of asynchronous scripts, trackers, and lazy-loaded assets. Standard audits frequently terminate when the initial
loadevent fires, missing late-stage network bloat and Cumulative Layout Shifts (CLS).
What is URL Inspector?
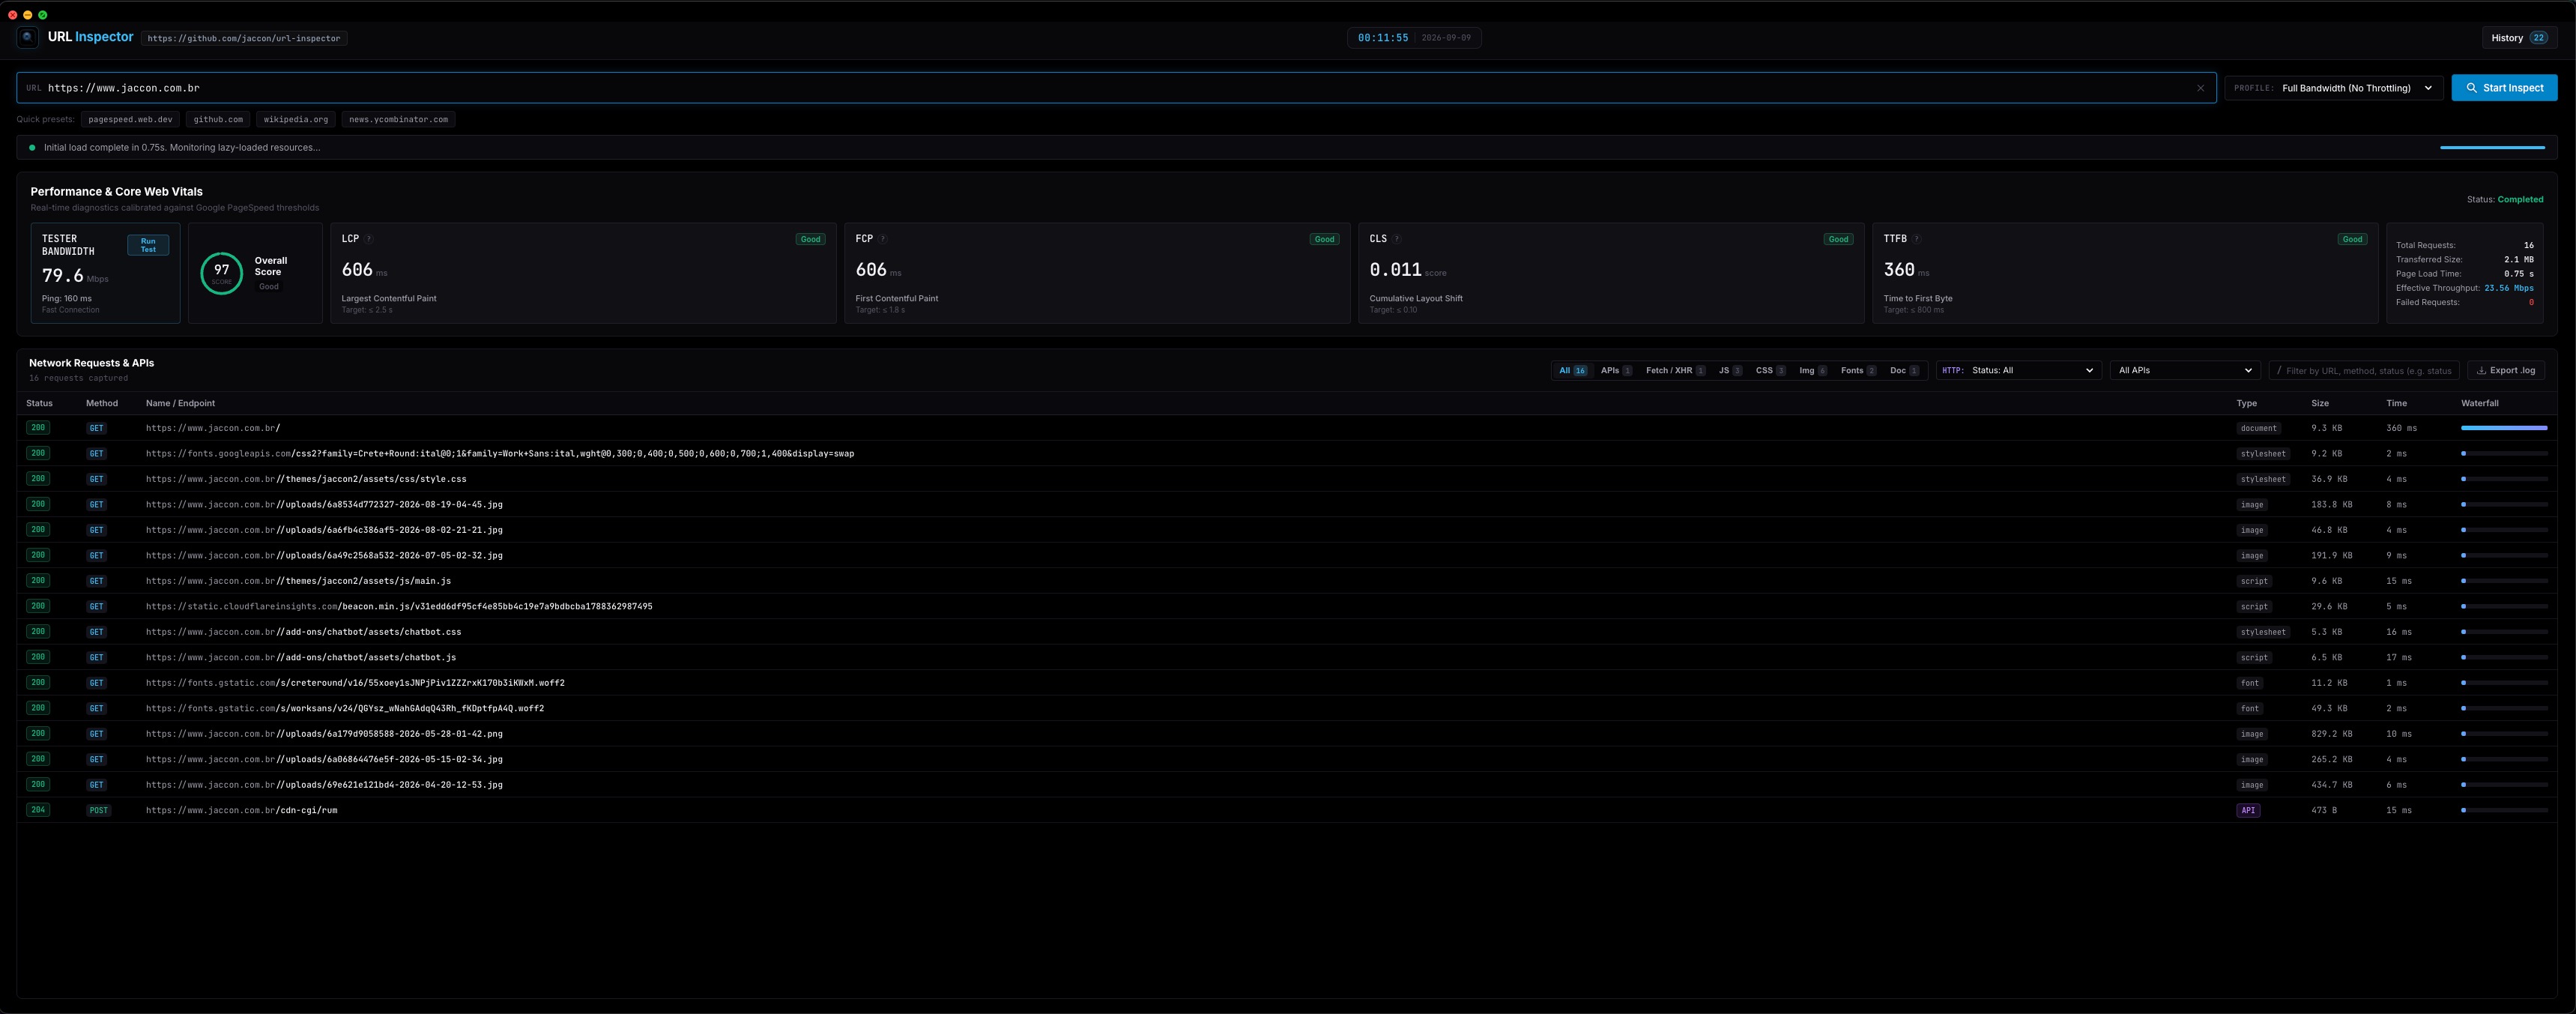
URL Inspector is an enterprise-grade desktop application built with Electron 30, Node.js 20, and Chromium. Rather than relying on high-level browser extensions or black-box web services, URL Inspector binds directly to Chromium's internal engine via the Chrome DevTools Protocol (CDP).
Wrapped in a Pure Black (#000000) Dark Mode aesthetic engineered for OLED clarity, URL Inspector acts as an authoritative diagnostic cockpit for any URL.
Core Engineering Features
1. Direct Chrome DevTools Protocol (CDP) Hook
Under the hood, URL Inspector initiates a headless Chromium target and opens an asynchronous debugger session (wc.debugger.attach('1.3')). By subscribing directly to Network., Page., and Performance.* domains, the application captures raw network events before web page scripts can manipulate or intercept them.
This unlocks microsecond-precision waterfall diagnostics:
- DNS Lookup Time
- TCP Connection Handshake
- SSL/TLS Negotiation
- Time to First Byte (TTFB / Server Processing)
- Content Download Duration
Additionally, URL Inspector tracks both Encoded Transfer Size (actual compressed bytes moving through the wire) and Decoded Body Size (uncompressed payload parsed by the browser memory).
2. Tester Bandwidth Probing: The Diagnostic Baseline
Before you evaluate how fast a website loads, you need to know how fast your current network is. URL Inspector features a dedicated Tester Bandwidth module that measures client download throughput (Mbps) and latency (ping ms) against lightweight global endpoints before running audits. This ensures you never mistake local Wi-Fi congestion for remote server degradation.
3. Deterministic Network Traffic Shaping
Testing on high-speed gigabit fiber doesn't reflect how users experience your application on mobile devices. URL Inspector includes built-in traffic shaping profiles enforced at the Chromium socket layer via Network.emulateNetworkConditions:
- Full Bandwidth: Line-rate unthrottled connection
- Broadband / Cable: 50 Mbps Download / 10ms Latency
- Fast 4G / LTE: 25 Mbps Download / 20ms Latency
- Slow 4G: 4 Mbps Download / 100ms Latency
- Fast 3G: 1.6 Mbps Download / 150ms Latency
- Slow 3G: 400 Kbps Download / 400ms Latency
4. Google Core Web Vitals & Weighted Scoring
URL Inspector measures and evaluates Core Web Vitals according to official Google PageSpeed and Lighthouse thresholds:
- LCP (Largest Contentful Paint): Main content render time ($\le 2.5\text{s}$ Good, $2.5\text{s} - 4.0\text{s}$ Needs Improvement, $> 4.0\text{s}$ Poor).
- FCP (First Contentful Paint): Time until visual DOM elements appear ($\le 1.8\text{s}$ Good).
- CLS (Cumulative Layout Shift): Measure of unexpected visual shifts ($\le 0.10$ Good).
- TTFB (Time to First Byte): Server responsiveness ($\le 800\text{ms}$ Good).
Interactive tooltips explain the criteria behind every metric, and an overall 0–100 Performance Score gives you an instant benchmark of overall page health.
5. Multi-Facet Filtering & API Origin Aggregation
Large web apps frequently trigger hundreds of requests. URL Inspector makes analysis effortless with:
- HTTP Status Filtering: Isolate specific status codes (
200,301,304,404,500) or filter by entire HTTP families (2xx Success,3xx Redirect,4xx Client Error,5xx Server Error). - API Origin Aggregator: Automatically aggregates and isolates endpoints by domain, allowing you to instantly distinguish between your first-party backend microservices and third-party analytics or CDN calls.
- Resource Categorization: Filter by Documents, Stylesheets, Scripts, Images, Fonts, APIs/XHR/Fetch, and Media.
6. Full-Screen SQLite History (Local Persistence)
Every audit you perform is automatically indexed in a local SQLite database (audit_history.sqlite) powered by WebAssembly (sql.js).
With a single click on History, you enter a dedicated full-screen historical dashboard that tracks:
- Execution timestamps
- Target URLs
- Overall performance scores
- Complete Core Web Vitals history
- Transferred byte weights and request counts
- One-click record deletion or complete history wipe
7. Structured Telemetry .log Export
Need to share diagnostic telemetry with your team or attach it to an incident post-mortem? With one click on Export Log, URL Inspector outputs an exhaustive plaintext .log or .txt file containing your system environment, bandwidth probe baselines, throttling configuration, Core Web Vitals breakdown, and every single intercepted HTTP request with its headers and timing statistics.
Architectural Principles: Zero Bloat, Total Privacy
In an era where desktop applications often bundle hundreds of megabytes of unnecessary frameworks, URL Inspector was engineered with strict discipline:
- Zero Frontend Bloat: The presentation layer is built with pure Vanilla JavaScript (ES2022), semantic HTML5, and native CSS custom properties. No heavy virtual DOM libraries or runtime overhead.
- Security by Design: Electron's
contextIsolationis strictly enforced. The renderer process has zero access to Node.js primitives or native system APIs, communicating exclusively through typed IPC bridges inpreload.js. - Complete Data Privacy: Your audit data, URLs, request headers, and historical records remain 100% local on your machine in SQLite. No tracking, no third-party telemetry, no cloud lock-in.
Getting Started
URL Inspector is open source and available for macOS (with native builds for both Apple Silicon and Intel architectures).
Quick Install (Prebuilt Binaries)
You can download the latest .dmg or .zip directly from the GitHub Releases page:
- Apple Silicon (M1 / M2 / M3 / M4):
URL Inspector-1.0.0-arm64.dmg - Intel (x86_64):
URL Inspector-1.0.0.dmg
Building from Source
bash1. Clone the repository
git clone https://github.com/jaccon/url-inspector.git
cd url-inspector
2. Use Node 20
nvm use 20
3. Install dependencies
npm install
4. Start the application
npm start
Running Tests & Packaging
bashRun the 45-test automated unit suite
npm test
Build native macOS installers (x64 and arm64)
npm run build:clean
Conclusion & What's Next
Web performance is not a one-time check — it is an ongoing engineering practice. URL Inspector was designed to give developers, architects, and SREs a fast, focused, and reliable desktop tool to inspect web applications with complete transparency.
The project is released under the MIT License. Check out the code, download the latest build, and feel free to contribute or open issues on GitHub:
🔗 GitHub Repository: https://github.com/jaccon/url-inspector
If you find the project helpful for your performance workflows, don't forget to star the repository!